What Single-Candle Patterns Are
Single candlestick patterns woh structures hain jahan ek hi candle se rejection, indecision, ya momentum ka hint milta hai. Common examples doji, hammer, hanging man, shooting star, aur marubozu hote hain.
In patterns ka real value tab hota hai jab candle kisi meaningful chart location par bane. Hammer random jagah par bas shape hai. Strong support ya pullback zone par bane to message stronger ho jata hai.
Isliye pattern naam yaad karna enough nahi hai. Pattern ka job hai context ko sharper banana, context ko replace karna nahi.
How to Read Hammer, Doji and Shooting Star
Hammer usually lower rejection dikhata hai. Agar down move ke baad support ke paas hammer aata hai aur next candle uske high ke upar close karti hai, buyers ka intent stronger lagta hai. Doji indecision dikhata hai. Iska matlab yeh nahi ki reversal confirmed hai; sirf itna ki control clear nahi tha.
Shooting star upper rejection dikhata hai. Up move ke baad resistance ke paas aaye to caution badhta hai. But short tabhi better hota hai jab next candle weakness confirm kare ya structure break mile.
Marubozu-type candle strong directional conviction dikhati hai. Lekin extended move ke baad same marubozu exhaustion bhi ho sakti hai. Location again decides quality.
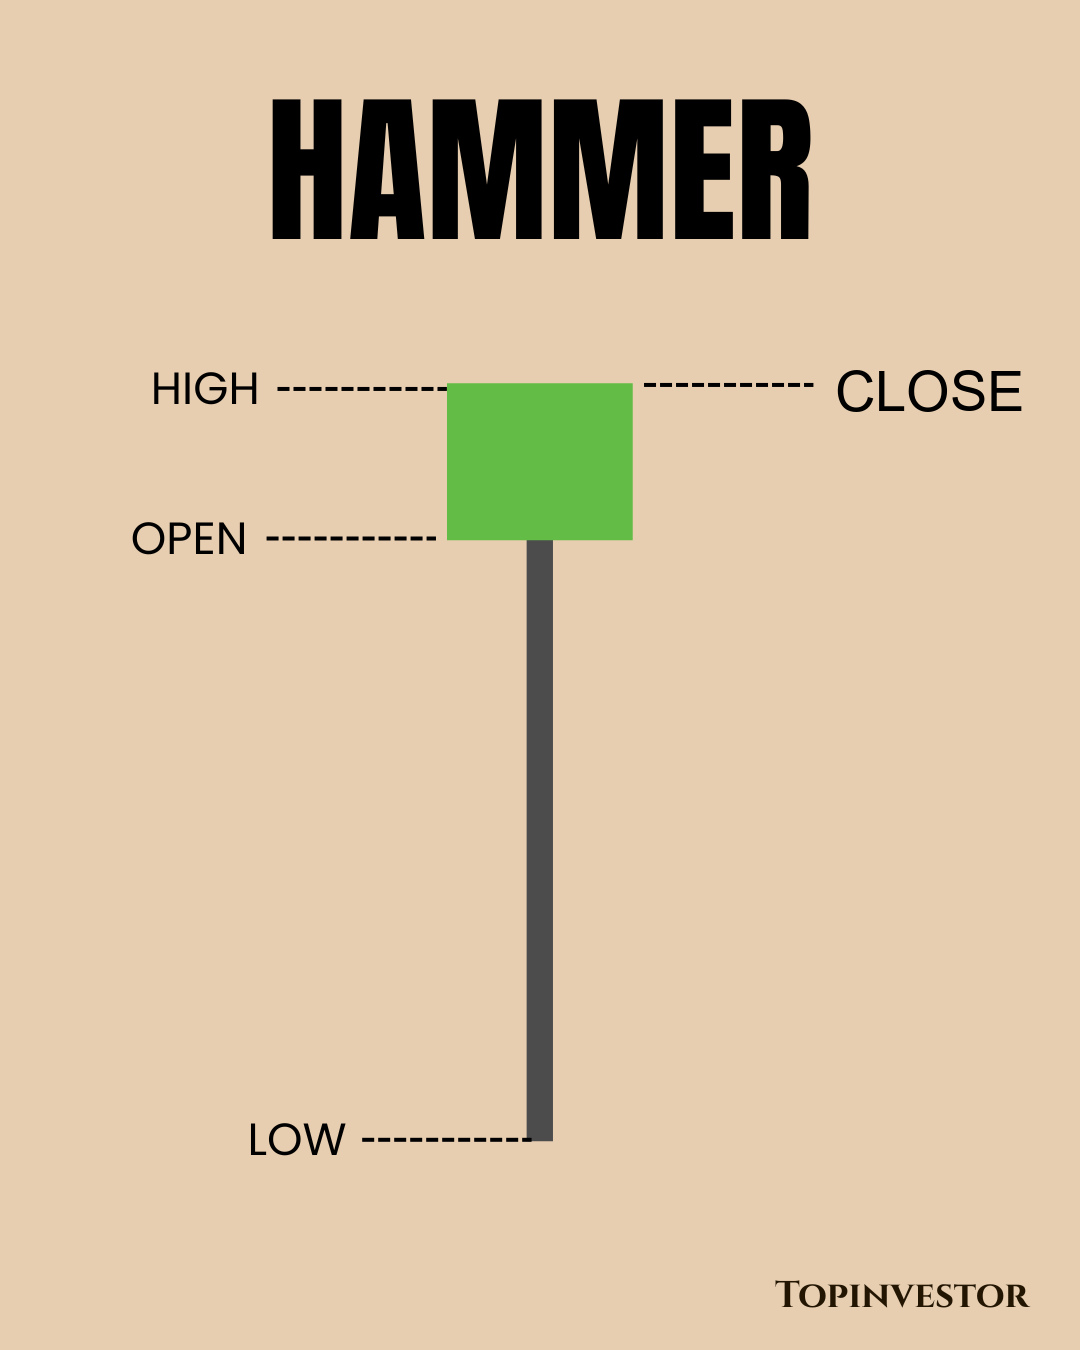
Hammer Candlestick
Where These Patterns Become Useful
Single-candle patterns pullback entries, support-resistance reactions, aur breakout retests par kaafi useful hote hain. Example: SBI uptrend mein pullback ke baad support zone par hammer banaye aur next session follow-through de, to trader structured entry plan bana sakta hai.
Yeh patterns specially tab help karte hain jab aapko entry timing refine karni ho. Aap overall bullish ho sakte ho, lekin entry better tab lagti hai jab market level par actual response bhi dikhaye.
Pattern ke saath volume aur candle close dekhna smart habit hai. Long lower wick but weak close kabhi-kabhi half-hearted recovery bhi ho sakti hai.
Common Mistakes With Single-Candle Patterns
Beginners har doji ko reversal samajh lete hain. Doji ka meaning aksar pause hota hai, final turn nahi. Same issue hammers aur shooting stars ke saath bhi hota hai.
Doosri mistake pattern ko isolated trade trigger banana hai. Agar trend strong down hai aur sirf ek hammer aaya hai, uske against aggressive buy risky ho sakta hai. Confirmation ya strong level ke bina pattern ka edge kam ho jata hai.
Third mistake textbook-perfect shape ke peeche bhaagna hai. Market real life mein perfect diagrams jaisa behave nahi karta. Slightly imperfect pattern bhi kaam kar sakta hai agar context strong ho.
Most Beginners Miss This
Single-candle pattern ka best use trend predict karna nahi, risk define karna hota hai. Agar candle kisi level par rejection dikhati hai, aapko invalidation clearer milti hai.
Seedha Samjho
Hammer, doji aur shooting star jaise single-candle patterns rejection, indecision ya momentum ka short signal dete hain. Inka value tabhi hota hai jab chart context unhe support kare.
Is concept ka use chart reading ko clearer banane ke liye karo, complicated banane ke liye nahi. Ek clean idea with proper context, aksar dus conflicting signals se better hota hai.
Real Chart Mein Iska Practical Use
Isi liye experienced traders process ko simplify karte hain. Unka focus weak information hata kar sirf un factors par rehna hota hai jo execution ko genuinely better banate hain.
Support par pullback ke baad bana hammer aur noisy range ke beech bana hammer same message nahi dete. Location, trend aur follow-through pattern ka meaning badal dete hain.
Practical test simple hai: setup dekhne ke baad pucho kya chart ab bhi space, confirmation aur logical trade location de raha hai. Agar nahi, to setup educational ho sakta hai, tradable zaroori nahi.
Practical chart-reading example: agar stock support zone par hammer banaye but volume weak ho aur next candle follow-through na de, to sirf pattern dekhkar entry lena jaldi ho sakta hai. Strong pattern tab banta hai jab rejection ke baad market actual acceptance bhi dikhaye.
Most Beginners Miss This
Yahi step chart reading ko random button-clicking se alag karta hai. Setup tabhi attention deserve karta hai jab evidence, timing aur location ek saath align ho.
Risk Management Se Connection
Most Beginners Miss This: doji aksar pause dikhata hai, guaranteed reversal nahi. Kaafi beginners indecision ko certainty samajhkar jaldi entry le lete hain.
Single-candle pattern ka best use risk define karna hai. Agar pattern aapko clean invalidation zone hi nahi de raha, to setup weak hai chahe candle textbook-perfect kyon na lage.
Technical setup tab stronger hota hai jab stop-loss structure se aaye aur target realistic chart space se. Isse reward-to-risk emotional hone ke bajay grounded rehta hai.
Strong setup bhi fail ho sakta hai, lekin well-planned setup aksar controlled tareeke se fail hota hai. Trading mein yeh difference bahut important hota hai.
Single-candle pattern ko kabhi bhi broader trend ke against akela use mat karo. Counter-trend setups mein stop tight lag sakta hai, lekin failure bhi fast hota hai, isliye position size aur confirmation dono aur important ho jate hain.
Quick FAQs
Is topic ko sabse simple tareeke se kaise samjhein?
Hammer, doji aur shooting star jaise single-candle patterns rejection, indecision ya momentum ka short signal dete hain. Inka value tabhi hota hai jab chart context unhe support kare. Pehle clarity lao, phir speed.
Beginner ise live chart par kaise use kare?
Support par pullback ke baad bana hammer aur noisy range ke beech bana hammer same message nahi dete. Location, trend aur follow-through pattern ka meaning badal dete hain. Agar chart confirmation ya move ka room nahi de raha, to wait karna aksar better decision hota hai.
Yahan beginners sabse zyada kya galat samajhte hain?
Most Beginners Miss This: doji aksar pause dikhata hai, guaranteed reversal nahi. Kaafi beginners indecision ko certainty samajhkar jaldi entry le lete hain. Yehi ek insight beginners ko low-quality entries se kaafi bachata hai.
Yeh risk management se kaise connect hota hai?
Single-candle pattern ka best use risk define karna hai. Agar pattern aapko clean invalidation zone hi nahi de raha, to setup weak hai chahe candle textbook-perfect kyon na lage. Achhi analysis tabhi tradable banti hai jab risk clearly defined ho.
Disclaimer
Yeh page sirf educational purpose ke liye hai. Koi bhi pattern, indicator, breakout, ya setup guaranteed profit nahi deta. Isse financial advice ya trade recommendation ki tarah treat na karein.